

Insurance fraud isn’t a lone bad actor filing a false claim. The costliest schemes are networks — rings of providers, attorneys, claimants, and shell entities whose connections span multiple systems, lines of business, and years of history. Traditional relational databases were never designed to see these connections. Knowledge graphs were.
Insurance fraud costs the U.S. economy an estimated $308.6 billion annually, and P&C carriers absorb $90–$122 billion of that total. And the problem is accelerating: In the 2026 Verisk State of Insurance Fraud Study, 98% of insurers assented that digital media fraud powered by AI editing capabilities is on the rise.
Most carriers have responded by adding more rules to existing detection systems. But modern fraud rings are specifically designed to defeat rules-based models — staying below individual detection thresholds by spreading activity across carriers, claim types, and time horizons.
Closing the gap requires a new architecture that treats relationships between entities as first-class data rather than an afterthought. AI fraud detection for insurance and knowledge graphs represents that architectural shift, revealing what relational systems cannot.
From Rules to Relationships: A Better Architecture for Fraud Detection
Most carrier fraud detection today relies on rules-based scoring applied to individual claims, wherein a scored above a threshold is flagged for manual review. That approach was designed for an era when schemes were simpler, more isolated, and easier to surface from a single record.
Modern fraud rings, however, are built to defeat this model. They distribute activity across carriers, claim types, and time horizons specifically to stay below individual detection thresholds.
Consider a medical provider filing claims with severity 20% above peers. It is suspicious, but not conclusive, so a traditional system might flag it for manual review and move on. What traditional systems miss is that every one of those claims has attorney representation, all routing through three ostensibly independent law firms that share a single phone number. No individual claim crosses a threshold. The network, viewed as a whole, is unambiguous.
The following diagram illustrates how graph traversal surfaces this network across three hops.
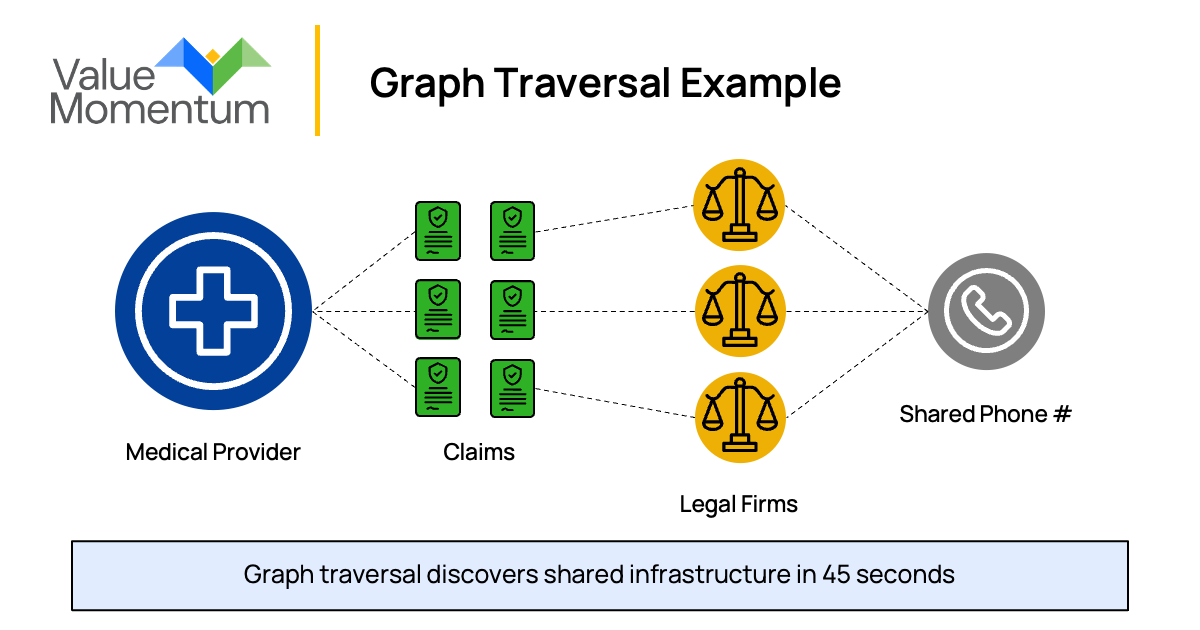
This is the core limitation of relational databases: Relationships between entities exist only as foreign keys, requiring manual joins across siloed tables. So, what are knowledge graphs used for in insurance fraud? At their core, they solve exactly this problem — treating entities and the connections between them as equally important data. Claimants, providers, attorneys, vehicles, addresses, and phone numbers become nodes. The relationships between them assemble a picture of a fraud ring that once took weeks of manual correlation in under a minute.
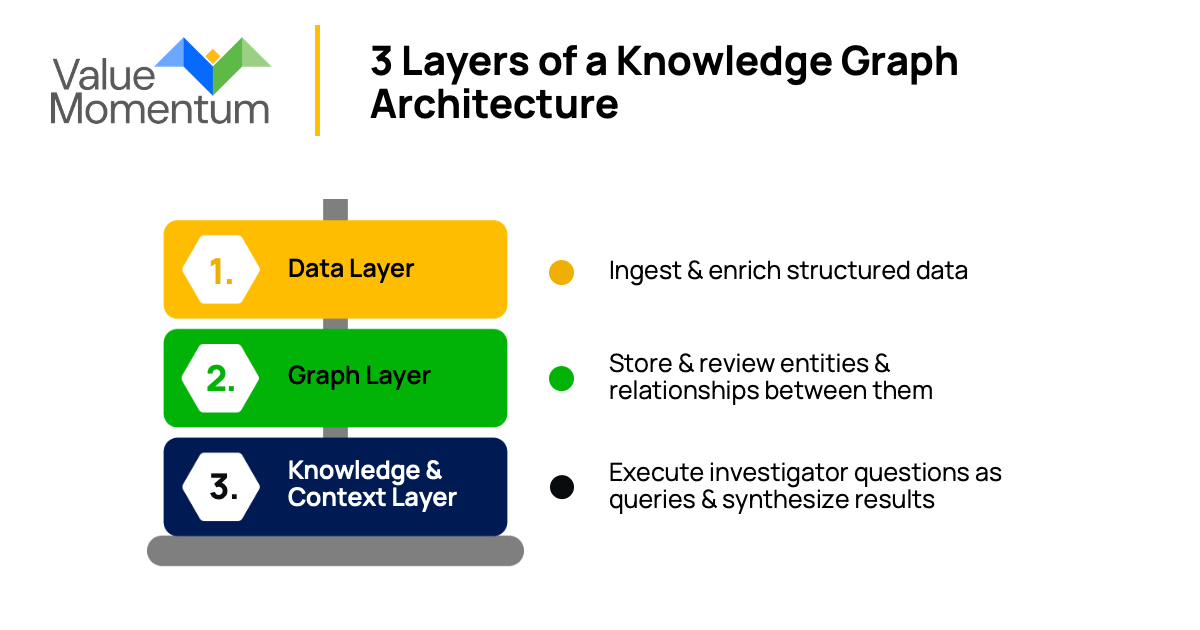
Tools like ValueMomentum’s graph-based fraud investigation platform put this capability directly in investigators’ hands. Built on Neo4j with a natural-language investigation assistant, the platform allows a special investigation unit (SIU) analyst to ask a plain-English question and receive a fully traversed answer — mapping the network in seconds rather than weeks.
The assistant classifies the investigator’s question, reasons through the relevant entities and relationships, translates that reasoning into a graph query, executes it against the live database, and synthesizes the findings with insurance domain context. The result is an explainable, auditable fraud signal rather than a black-box score.
Making AI Fraud Detection for Insurance Work
For carrier CXOs, the decision to invest in knowledge graphs for insurance fraud detection is not simply a claims operations concern. It is a strategic lever with direct implications across the business.
The most immediate benefit is improved loss ratio. Every dollar of fraudulent claims paid erodes the combined ratio. Carriers that detect and deny organized fraud earlier sustain structurally lower loss ratios than peers, which is a durable advantage in a market where underwriting discipline determines long-run viability. SIU productivity follows directly, with graph-based approaches dramatically improving the signal-to-noise ratio of fraud referrals, letting investigators focus on high-probability cases rather than chasing manual hunches.
As a result, the same team stops more fraud. And lower fraud leakage means lower costs embedded in premiums, allowing carriers to price more competitively in clean-risk segments without subsidizing fraud through undifferentiated rates.
But adoption of advanced fraud detection capabilities remains uneven. According to WTW’s 2026 Advanced Analytics and AI Survey, only 33% of P&C insurers currently use AI fraud detection for insurance at the claims level, though that figure is expected to reach 65–70% within two years. For carriers still in the exploratory stage, the window to build institutional graph knowledge ahead of their peers is narrowing.
The path to graph adoption follows a consistent pattern regardless of where an organization starts:
For carriers in the exploratory stage:
1. Invest in data plumbing. A knowledge graph is only as powerful as the entities and relationships fed into it. Cross-system entity resolution, or linking the same person, provider, or address across claims, policy, and billing systems, is the foundational work that unlocks graph value. Without it, the graph cannot traverse what it cannot see.
2. Start with a focused use case. Provider-attorney collusion and staged accident rings offer the clearest early return on investment because the relationship patterns are well-documented and the results are measurable. A contained pilot in one line of business, with a defined fraud scenario and a clear success metric, is a faster path to organizational buy-in than a broad platform initiative.
For carriers actively piloting:
3. Prioritize investigator enablement. A natural-language investigation interface dramatically lowers the skill barrier to adoption beyond the analytics team. If investigators cannot use the tool without data science support, the graph will remain a proof of concept rather than an operational capability.
For carriers scaling graph adoption:
4. Govern the graph like a product, not a project. It needs a named owner — typically a Chief Data Officer, VP of Claims Analytics, or Head of SIU — with a cross-functional operating team and a roadmap for continuous enrichment. As investigation outcomes feed back into the graph as confirmed edges, the network becomes progressively smarter. Carriers that invest in ongoing stewardship consistently outperform those that treat graph adoption as a one-time build.
Every quarter of delay is a quarter in which fraud rings grow more sophisticated and peer carriers build institutional graph knowledge that is difficult to replicate. The question is not whether to make the shift but where to begin.
The Window Is Narrowing
Fraud rings have already industrialized. They operate across carriers, exploit siloed detection systems, and scale schemes faster than manual investigation can follow. Knowledge graphs for insurance fraud detection are not an emerging experiment; they are a proven architecture already in production at leading carriers.
The shift from rules to relationships is the defining capability difference between the carriers rooting out organized fraud and those who are funding it. For insurers serious about making AI fraud detection for insurance work, the path forward is clear: treat relationships as data, govern the graph as a product, and start with a use case where the network patterns are already well understood.
Interested in learning more about advanced analytics in insurance? Read ValueMomentum’s whitepaper, “Driving Business Value with Insurance Data Analytics,” to gain insights into how these tools are being employed across the insurance value chain.